4
Water Quality
Monitoring Requirement
4.1
According
to the EM&A Documents for HKLR, baseline water quality monitoring shall be carried out three times per week for a period of
4 weeks at all the monitoring
locations prior to the commencement of
marine works. The interval between two sets of monitoring will not be less than
36 hours.
4.2
Replicate
in-situ measurements and samples collected from each independent sampling event
shall be collected to ensure a robust statistically interpretable database.
4.3
Baseline
water quality monitoring was conducted three times per week for four
consecutive weeks prior to the commencement of marine works. Monitoring took place two times per
monitoring day during mid ebb (within + 1.75 hours of the predicted
time) and mid flood tides (within + 1.75 hours of the predicted time) at three depths (i.e.
Monitoring Locations
4.4
Baseline
water quality monitoring was conducted at 14 monitoring stations under the Contract which are summarized in Table 4.1. The monitoring station is also shown in Figure 3.
Table 4.1 Location
for Marine Water Quality Monitoring Locations
|
Monitoring Stations |
Coordinates |
|
|
Easting |
Northing |
|
|
IS1 |
803474 |
815060 |
|
IS2 |
804851 |
815715 |
|
IS3 |
806502 |
815743 |
|
IS4 |
807008 |
816986 |
|
CS1 |
801784 |
812711 |
|
CS2 |
805849 |
818780 |
|
SR1 |
803126 |
812379 |
|
SR2 |
807856 |
816953 |
|
SR3 |
810525 |
816456 |
|
SR6 |
805837 |
821818 |
|
ST1 |
802677 |
816006 |
|
ST2 |
804055 |
818840 |
|
ST3 |
800667 |
810126 |
|
SRA |
809872 |
817152 |
Monitoring Equipment
Dissolved Oxygen (DO) and Temperature Measuring Equipment
4.5
The
instrument for measuring dissolved oxygen and temperature was portable and
weatherproof complete with cable, sensor, comprehensive operation manuals and
use DC power source. It was capable of measuring:
��
a dissolved oxygen level in the
range of 0-20 mg/L and 0-200% saturation; and
��
a temperature of 0-45 degree
Celsius.
4.6
It has
a membrane electrode with automatic temperature compensation complete with a
cable.
4.7
Sufficient
stocks of spare electrodes and cables were available for replacement where
necessary.
4.8
Salinity
compensation was built-in in the DO equipment.
Turbidity
4.9
Turbidity
was measured in situ by the nephelometric method. The instrument was portable
and weatherproof using a DC power source complete with cable, sensor and
comprehensive operation manuals. The equipment was capable of measuring
turbidity between 0-1000 NTU. The probe cable was not less than
Sampler
4.10
A water
sampler, consisting of a transparent PVC or glass cylinder of a capacity of not
less than two litres which can be effectively sealed with cups at both ends was
used. The water sampler has a positive latching system to keep it open and
prevent premature closure until released by a messenger when the sampler was at
the selected water depth.
Water Depth Detector
4.11
A
portable, battery-operated echo sounder was used for the determination of water
depth at each designated monitoring station.
pH
4.12
The
instrument was consisting of a potentiometer, a glass electrode, a reference
electrode and a temperature-compensating device. It was readable to 0.1pH in a
range of 0 to 14. Standard buffer solutions of at least pH 7 and pH 10 were
used for calibration of the instrument before and after use.
Salinity
4.13
A
portable salinometer capable of recording salinity within the range of 0-40 ppt
was used for salinity measurements.
Monitoring Position Equipment
4.14
A hand
held Global Positioning System (GPS) / Leica GS15 GNSS receiver professional
(GNSS) was used during water quality monitoring to ensure the monitoring vessel
is at the correct location before taking measurements.
Sample Container and Storage
4.15
Following
collection, water samples for laboratory analysis were stored in high density
polythene bottles (250ml/
Calibration of In Situ Instruments
4.16
All in
situ monitoring instruments were checked, calibrated and certified by a
laboratory accredited under HOKLAS or other international accreditation scheme
before use, and subsequently re-calibrated at 3 monthly intervals throughout
all stages of the water quality monitoring programme. Responses of sensors and
electrodes were checked with certified standard solutions before each use. Wet
bulb calibration for a DO meter was carried out before measurement at each monitoring
event.
4.17
For the
on site calibration of field equipment (Multi-parameter Water Quality System),
the BS 1427:2009, "Guide to on-site test methods for the analysis of
waters" was observed.
4.18
Sufficient
stocks of spare parts were maintained for replacements when necessary. Backup
monitoring equipment was also being made available so that monitoring can
proceed uninterrupted even when some equipment was under maintenance,
calibration, etc.
Monitoring Equipment
4.19
The
equipment used in the baseline water quality monitoring program in 2011 and copies
of the calibration certificates for baseline water quality monitoring program
in 2011 can be referred to Baseline Environmental Monitoring Report for HKBCF.
4.20
The
equipment used for baseline water quality monitoring at SRA is shown in Table 4.2 and copies of the calibration
certificates is shown in Appendix D. All the monitoring equipment complied
with the requirements set out in the EM&A Documents for HKLR.
Table 4.2 Water
Quality Monitoring Equipment
at SRA
|
Equipment |
Model and Make |
Qty. |
|
Water Sampler |
Kahlsico
Water-Bottle Model 135DW 150 |
1 |
|
Multi-parameter
Water Quality System |
YSI 6820-C-M |
2 |
|
Monitoring
Position Equipment |
Leica GS15 GNSS
receiver professional (GNSS) |
1 |
Monitoring Parameters, Frequency
4.21
Table 4.3 summarizes the monitoring parameters, monitoring period and frequencies
of the water quality monitoring.
Table 4.3 Water
Quality Monitoring Parameters and Frequency
|
Monitoring
Stations |
Parameters,
unit |
Depth |
Frequency |
|
IS1, IS2, IS3 IS4, CS1, CS2, SR1, SR2,
SR3, SR6, ST1, ST2, ST3, *SRA |
��
Temperature(��C) ��
pH(pH unit) ��
turbidity (NTU) ��
water depth (m) ��
salinity (ppt) ��
dissolved
oxygen (DO) (mg/L and % of saturation) ��
suspended
solids (SS) (mg/L) |
��
3 water depths: ��
If the water
depth is less than ��
If water depth
less than |
��
Baseline monitoring: 3 days per week, at mid-flood and mid-ebb tides,
for a period of 4 weeks prior to
the commencement of the marine works |
* Additional
monitoring points from EM&A Manual
4.22
Monitoring
location/position, time, water depth, sampling depth, tidal stages, weather
conditions and any special phenomena or work underway nearby shall also be recorded.
Monitoring Methodology
Instrumentation
4.23
A
multi-parameter meters (Model YSI 6820-C-M /YSI 6920) were used to measure DO,
turbidity, salinity, pH and temperature.
Operating/Analytical Procedures
4.24
At each
measurement, two consecutive measurements of DO concentration, DO saturation, salinity,
turbidity, pH and temperature were taken.
The probes were retrieved out of the water after the first measurement
and then re-deployed for the second measurement. Where the difference in the value
between the first and second readings of each set was more than 25% of the
value of the first reading, the reading was discarded and further readings were
taken.
Laboratory Analytical Methods
4.25
The
testing of all parameters was conducted by Wellab Ltd. (HOKLAS Registration
No.083) for the water samples collected in 2011 and the testing of all
parameters for water samples at SRA was conducted by CMA Testing and
Certification Laboratories (HOKLAS Registration No.004) and comprehensive
quality assurance and control procedures in place in order to ensure quality
and consistency in results. The testing method, reporting limit and detection
limit are provided in Table 4.4.
Table 4.4 Methods
for Laboratory Analysis for Water Samples
|
Determinant |
Instrumentation |
Analytical Method |
Detection Limit |
|
Suspended Solid (SS) |
Weighing |
Wellab Ltd.: APHA 17e 2540D CMA: APHA 21e 2540D |
0.5 mg/L |
QA/QC Requirements
Decontamination Procedures
4.26
Water
sampling equipment used during the course of the monitoring programme was
decontaminated by manual washing and rinsed clean seawater/distilled water
after each sampling event. All disposal equipment was discarded after sampling.
Sampling Management and Supervision
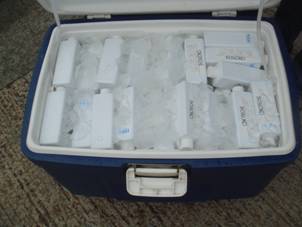
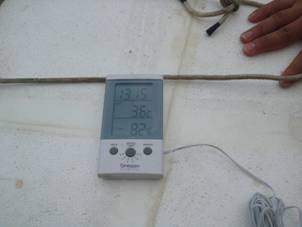
4.27
All sampling bottles were labelled with the sample
I.D (including the indication of sampling station and tidal stage e.g.
IS1_me_a), laboratory number
and sampling date. Water
samples were dispatched to the testing laboratory for analysis as soon as
possible after the sampling. All samples were stored in a cool box and kept at
less than
|
Photo |
Photo 1b - All samples were kept at less than |
4.28
The
laboratory determination works were started within 24 hours after collection of
the water samples.
Quality Control Measures for Sample Testing
4.29
The samples
testing were performed by Wellab Ltd / CMA Testing and Certification
Laboratories.
4.30
The
following quality control programme was performed by the Wellab Ltd for
every batch of 20 samples:
² One method blank; and
² One set of quality control (QC) samples
(including method QC and sample duplicate).
4.31
The
following quality control programme was performed by the CMA Testing and
Certification Laboratories for every batch of 12 samples:
² One set of quality control (QC) samples.
Maintenance and Calibration
4.32
Before
each round of monitoring, a zero check in distilled water was performed with
the turbidity probe of YSI 6820-C-M /YSI 6920. The probe was then calibrated with a
solution of known NTU.
4.33
QA/QC
procedures are available for the SS analyzed in the HOKLAS-accredited
laboratory, WELLAB Ltd which can be referred to Baseline Environmental
Monitoring Report for HKBCF.
4.34
QA/QC
procedures are available for the SS analyzed in the HOKLAS-accredited
laboratory, CMA Testing and Certification Laboratory which is shown in Appendix C.
Results and Observations
Results
4.35
Baseline
water quality monitoring at 13 monitoring stations was conducted between 6th
and 31st October 2011.
The monitoring results and graphical presentation of water quality at
the monitoring stations can be referred to Appendix
G and the Baseline Environmental Monitoring Report for HKBCF respectively.
4.36
Baseline
water quality monitoring at SRA was conducted between 8th November
2012 and 2nd December 2012.
The monitoring results, graphical presentation and laboratory testing
report of water quality at SRA are shown in Appendix C.
4.37
Detailed
weather conditions at the monitoring locations during the baseline monitoring
period are shown in Appendix B. The
detailed monitoring schedule is shown in Appendix
A.
Observations
4.38
During
the baseline monitoring period, no marine construction works in the area (vicinity
of all monitoring stations) was noted. Thus, there was no observable pollution
source identified in the vicinity of all monitoring stations during the
baseline monitoring programme.
4.39
Measurements
and water sampling were conducted according to the instructions as stated in
the EM&A Documents for HKLR that listed in Table 4.3.
4.40
Since
no observable pollution activity was identified for all stations during
sampling, the baseline monitoring results are considered representative of the
ambient water quality levels.
Action and Limit Levels
4.41
The
Action and Limit levels for DO, SS and turbidity have been set in compliance
with the requirements set out in the EM&A Documents, which are summarized
in Table 4.5.
Table 4.5 Action and Limit Levels
for Water Quality
|
Parameter
(unit) |
Water Depth |
Action Level |
Limit Level |
|
Dissolved Oxygen (mg/L)
(surface, middle, bottom) |
Surface and Middle |
5%-ile of baseline data |
4 mg/L except 5mg/L for
FCZ or 1%-ile of baseline data |
|
Bottom |
5%-ile of baseline data |
2 mg/L or 1%-ile of
baseline data |
|
|
Turbidity (NTU) |
Depth average |
95%-ile of baseline data
or 120% of upstream control station��s turbidity at the same tide of the same
day |
99%-ile of baseline or
130% of turbidity at the upstream
control station at the same tide of same day |
|
Suspended Solids (mg/L) |
Depth average
|
95%-ile of baseline data
or 120% of upstream control station��s SS at the same tide of the same day |
99%-ile of baseline or
130% of SS at the upstream
control station at the same tide of same day and 10mg/L for WSD Seawater
Intakes |
(1)
Depth-averaged is calculated by taking the arithmetic means of reading of all
three depths
(2) For DO, non-compliance
of the water quality limit occurs when monitoring result is lower that the
limit.
(3) For SS & turbidity
non-compliance of the water quality limits occur when monitoring result is
higher than the limits.
(4) All the
figures given in the table are used for reference only and the EPD may amend
the figures whenever it is considered as necessary.
4.42
The
calculated Action and Limit levels are shown in Table 4.6.
Table
4.6 Calculated
Action and Limit Levels for Water Quality
|
Parameter
(unit) |
Water Depth |
Action Level |
Limit Level |
|
Dissolved Oxygen (mg/L)
(surface, middle, bottom) |
Surface and Middle |
5.0 |
4.2 except 5 for FCZ |
|
Bottom |
4.7 |
3.6 |
|
|
Turbidity (NTU) |
Depth average |
27.5 or 120% of upstream
control station��s turbidity at the same tide of the same day |
47.0 or 130% of turbidity at the upstream control
station at the same tide of same day |
|
Suspended Solids (mg/L) |
Depth average
|
23.5 or 120% of upstream
control station��s SS at the same tide of the same day |
34.4 or 130% of SS at the upstream control station at
the same tide of same day and
10mg/L for WSD Seawater Intakes |
Note:
(1)
Depth-averaged is calculated by taking the arithmetic means of reading of all
three depths
(2) For DO,
non-compliance of the water quality limit occurs when monitoring result is
lower that the limit.
(3) For SS &
turbidity non-compliance of the water quality limits occur when monitoring
result is higher than the limits.
(4) All the
figures given in the table are used for reference only and the EPD may amend
the figures whenever it is considered as necessary.
(5) The 1%-ile
of baseline data for dissolved oxygen (surface and middle) and dissolved oxygen
(bottom) are 4.2mg/L and 3.6mg/L respectively.
4.43
The Action
and Limit levels for DO, SS and turbidity have been further updated according
to the Proposal for changing Action and Limit Levels for water quality
monitoring which was submitted to EPD on 15 March 2013. No objection was
received from EPD according to the letter (ref. (10) in Ax(3) to
EP2/G/A/129pt.4) dated 25 March 2013. Therefore, the updated Action and Limit
Levels for water quality monitoring was used for comparison starting from 25
March 2013, which are summarized in Table
4.7.
Table 4.7 Updated Action and Limit Levels for
Water Quality
|
Parameter
(unit) |
Water Depth |
Action Level |
Limit Level |
|
Dissolved Oxygen (mg/L)
(surface, middle, bottom) |
Surface and Middle |
5.0 |
4.2 except 5 for FCZ |
|
Bottom |
4.7 |
3.6 |
|
|
Turbidity (NTU) |
Depth average |
27.5 and 120% of upstream
control station��s turbidity at the same tide of the same day |
47.0 and 130% of turbidity at the upstream control
station at the same tide of same day |
|
Suspended Solids (mg/L) |
Depth average
|
23.5 and 120% of upstream
control station��s SS at the same tide of the same day |
34.4 and 130% of SS at the upstream control station at
the same tide of same day and
10mg/L for WSD Seawater Intakes |
Note:
(1) Depth-averaged is calculated by taking the arithmetic
means of reading of all three depths
(2) For DO, non-compliance of the water quality
limit occurs when monitoring result is lower that the limit.
(3) For SS & turbidity non-compliance of the
water quality limits occur when monitoring result is higher than the limits.
(4) All the figures given in the table are used for
reference only and the EPD may amend the figures whenever it is considered as
necessary.
(5) The 1%-ile of baseline data for dissolved
oxygen (surface and middle) and dissolved oxygen (bottom) are 4.2mg/L and
3.6mg/L respectively.